Hydrology Explorer
The Hydrology Explorer app uses the BEACONs catchments dataset as building blocks for identifying upstream and downstream areas of an area of interest and provide hydrological metrics on them. The user need first to identify a study area which is defined by the extent of an intactness layer by either selecting a FDA for which intactness and footprint maps have been pre-computed using disturbances buffered with 500m or by uploading the a .gpkg created by the Regional Disturbance Explorer app. The user can then specify the area of interest for which the upstream and downstream area will be computed by uploading a polygon of by interactively selecting catchments on the mapviewer. also allows users to assess the influence of buffer size and minimum patch size on the resulting intactness and footprint maps. Currently, the app can only be used in the southeast Yukon.
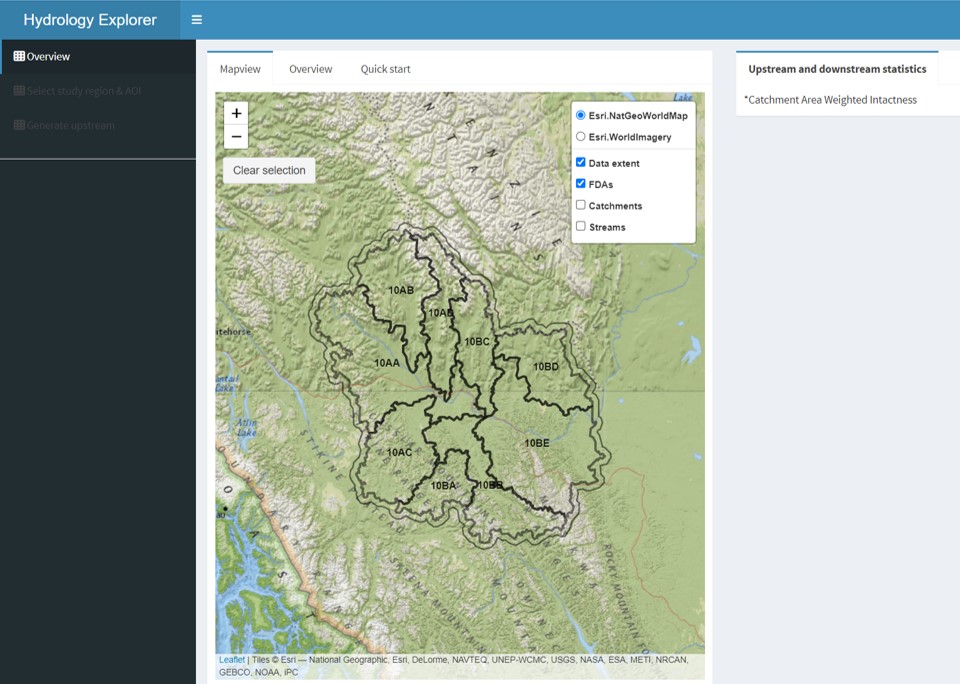
Figure 1. Shiny-based disturbance explorer app.
Functionality
The app consists of three sections:
Overview:
- Provides a description of the app, its functionality, and the demo datasets.
Select a study area and AOI:
- Choose intactness map and study area from one of the two options:
- Select an existing fundamental drainage area (disturbances buffere dwith 500m)
- Upload a geopackage (‘.gpkg’) created by the Regional Disturbance Explorer. The extent of your study area will be defined as the extent of the intactness map found in the .gpkg.
- Choose Area of Interest (AOI) from one of the two options:
- Upload your own polygon. Polygon must be provided as .gpkg. The projection must be EPSG:3579 (NAD83(CSRS) / Yukon Albers). Moreover, the polygon must overlay the study area.
- Generate AOI by interactively selecting catchments within your study area
Generate upstream and downstream:
View upstream, downstream and downstream stem area of your area of interest. Results are provided using the percent of intactness for each catchment. Hydrological metrics such as total areas of each component and mean of catchment area weighted intactness are provided in the adjacent table.
Download the results. The output is provided as .gpkg and it includes the following:
- Boundary of the study area
- Footprint map of the study area
- Intactness map of the study area
- Boundary of the area of interest
- Catchments overlaying the study area
In the catchments layer, catchment intactness is provided using decimal (0-1) and the identification of each catchment to either upstream, downstream and downstream stem is provided using binomial value.
Input data
Mapview
The key input data are: - Intactness and footprint map generated by the Regional Disturbance Explorer, and - Area of interest (can be uploaded or generated using a selected set of catchments)
Pre-compute intactness and footprint maps are provided within the tool. Those were generated at the FDA level using the disturbances buffered with 500m. The identification of the upstream and downstream catchments can only be computed across the FDA 10, which comprised 9 fundamental drainage areas (watersheds) located in the Yukon and British Columbia.
The identification of upstream and downstream catchment can’t currently go beyond those wathersheds because of the extent of the catchment layer provided within the tool.
Overview
The purpose of the Hydrology Explorer app is to identify upstream and downstream areas of an area of interest and provide hydrological metrics on them. This page provides a “quick start” to using the app by describing the main functions of the app.
The Overview section provides a description of the app and its functionality. You can start using the app by turning on and off the various layers in the map legend.
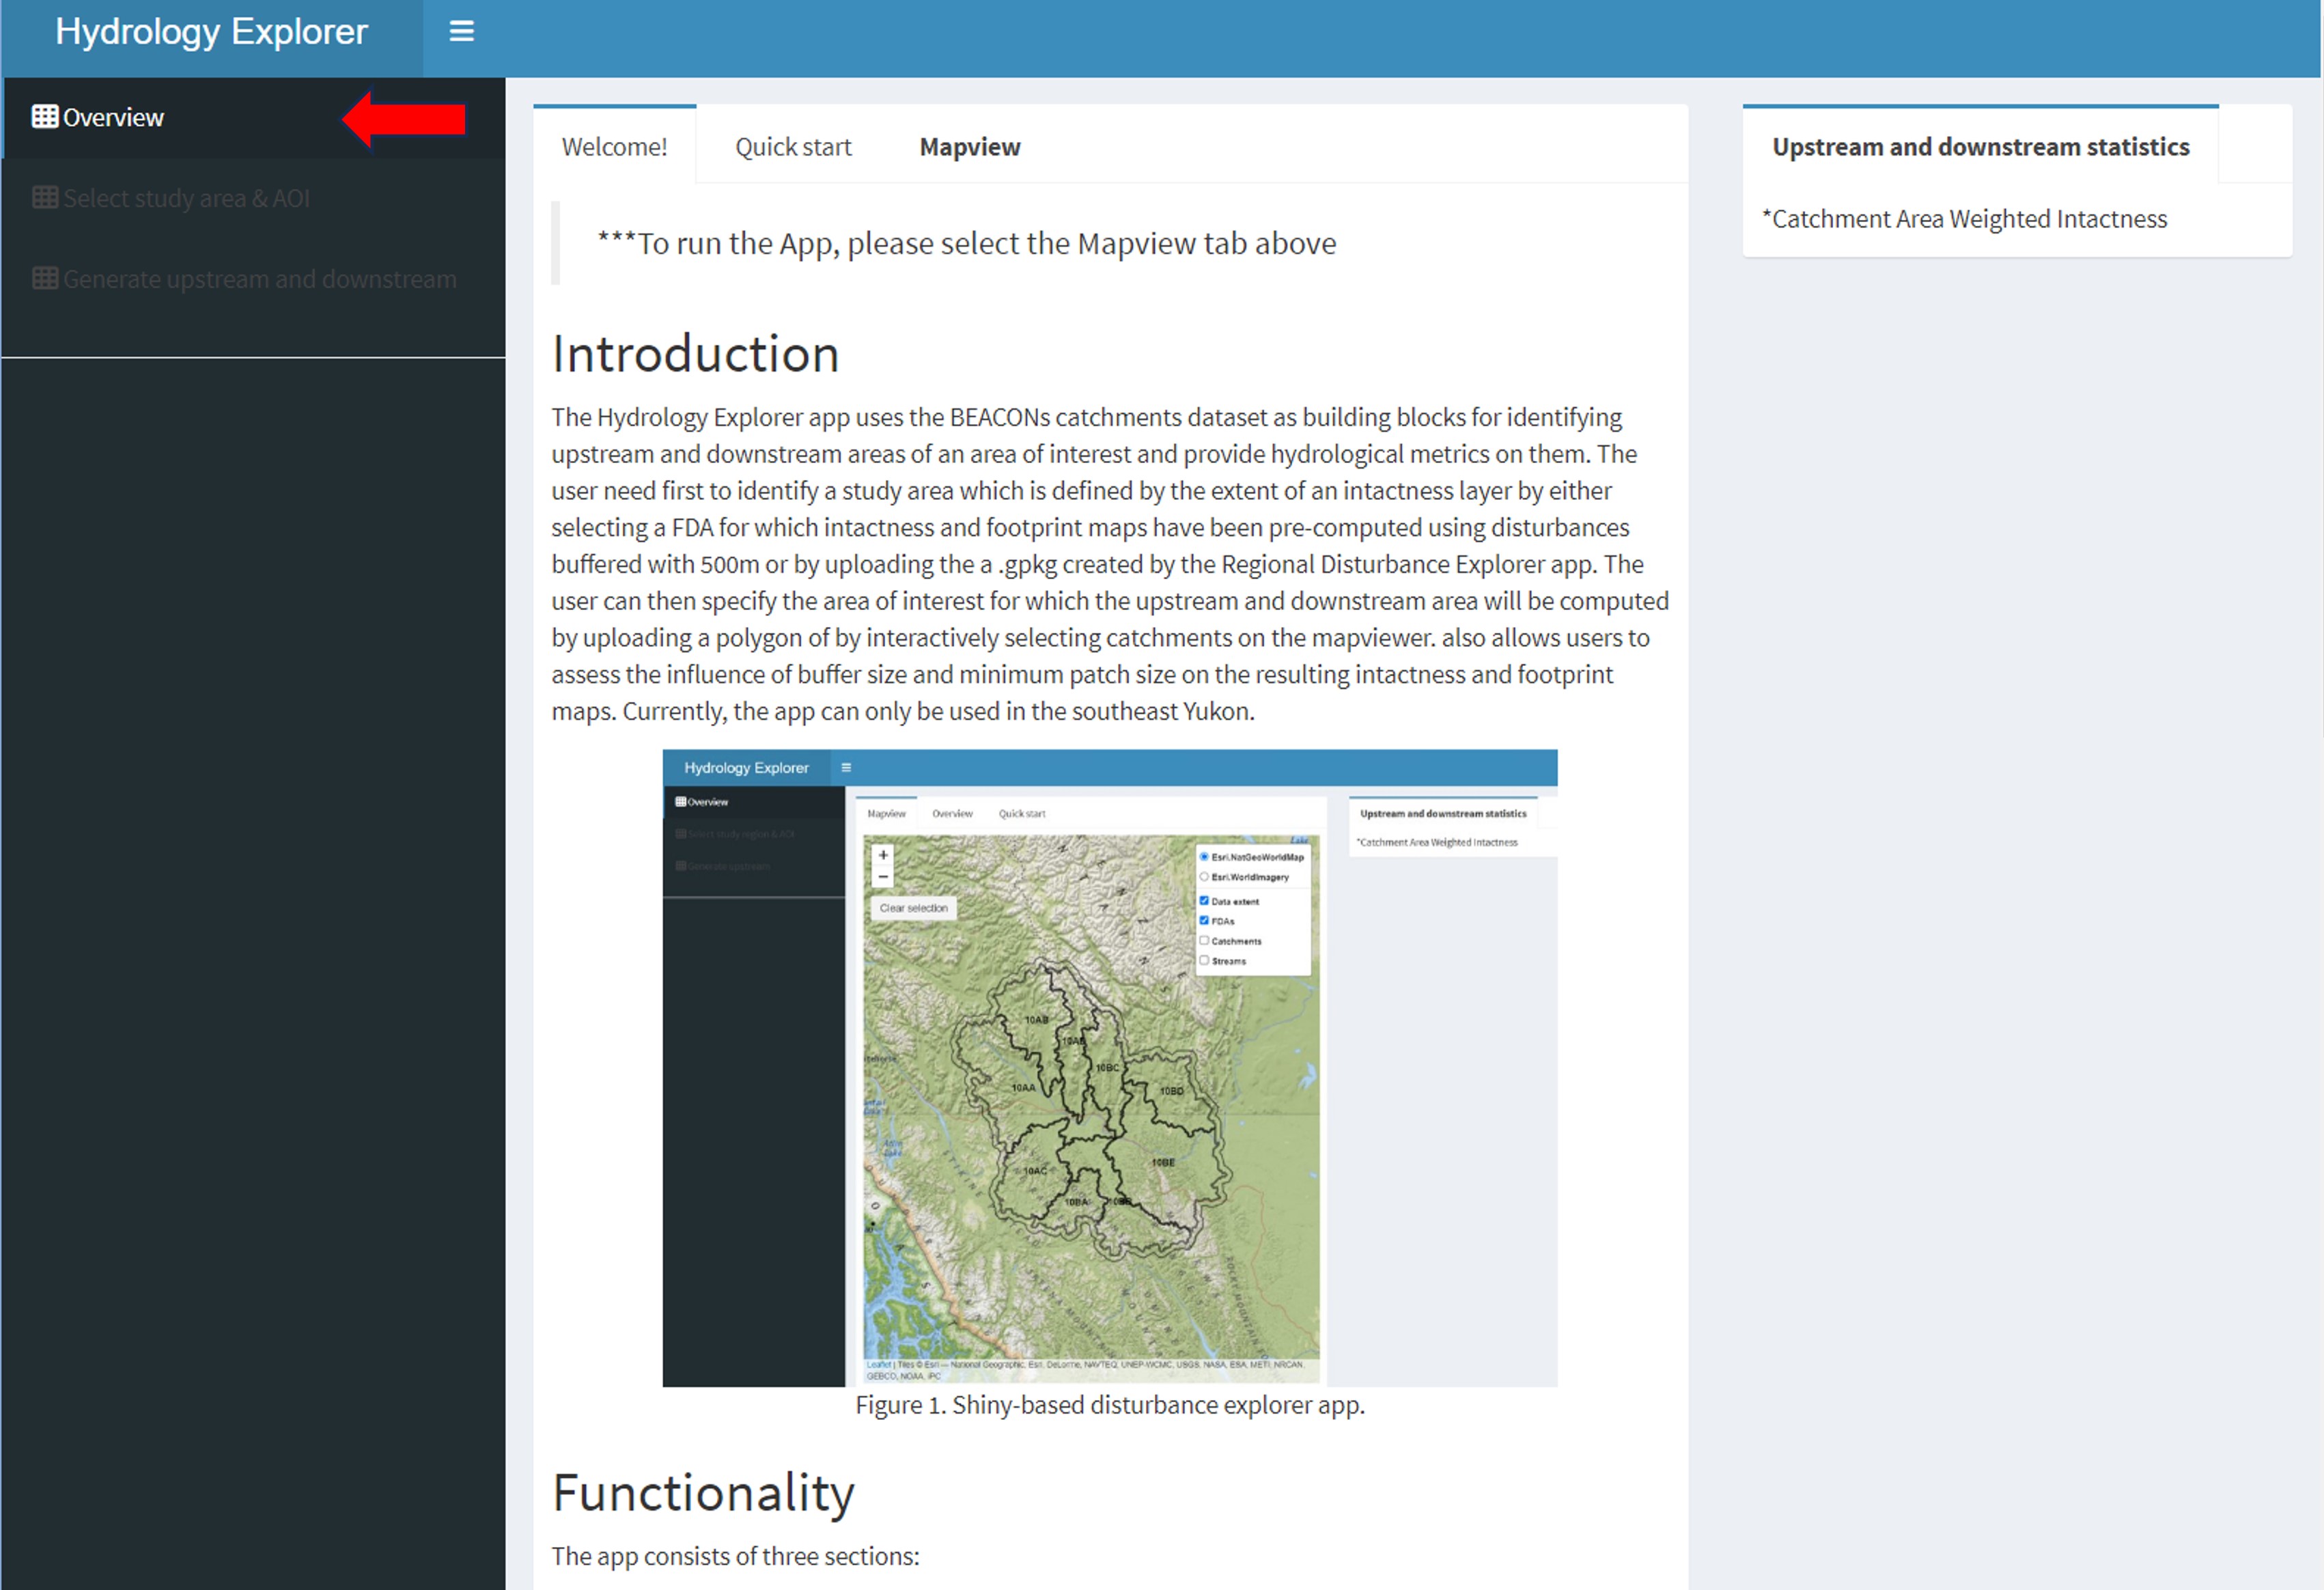
Figure 1. Shiny-based hydrology explorer app.
Select study region & AOI
Click on Select study area & AOI to first select the extent on which you want to perform the analysis. You have two choices:
- Select an existing fundamental drainage area (FDA) to use the default intactness and footprint map that were generated using disturbances buffered with 500m.
- Upload a study area as a geopackage (‘.gpkg’).
If you upload a study area, the geopackage must be generated using the Regional Disturbance Explorer app.
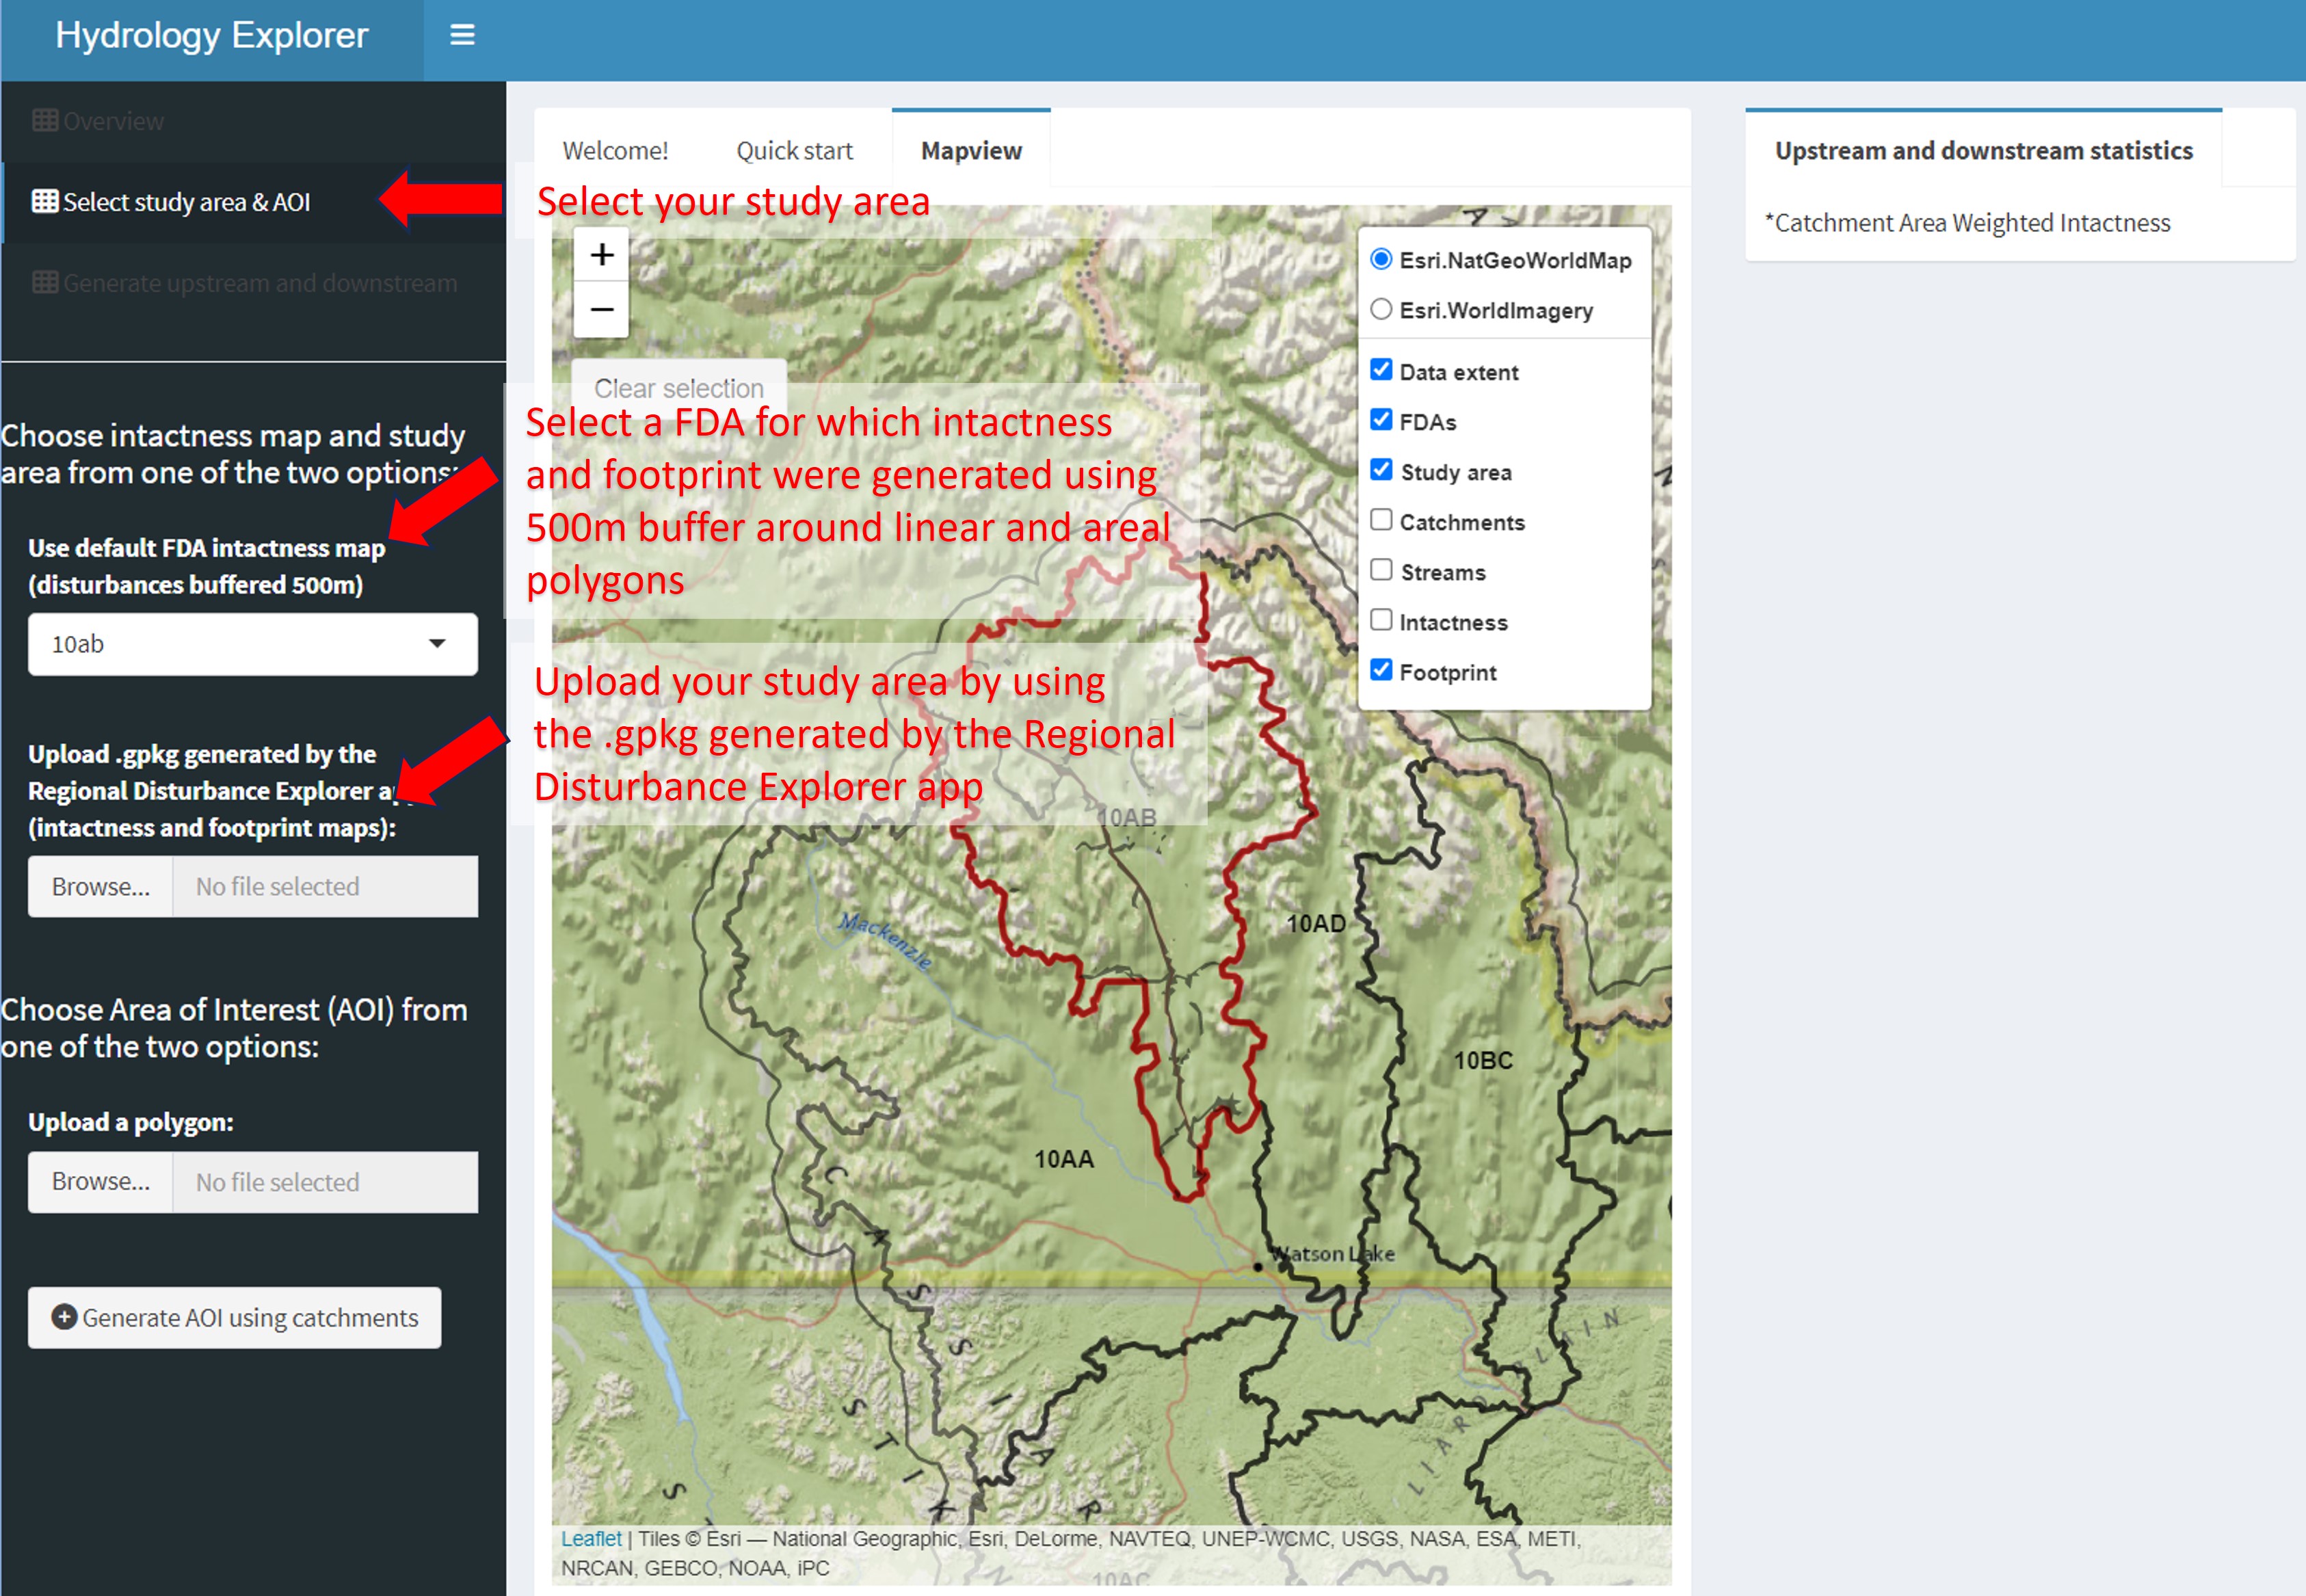
Figure 2. Select the study area.
After a few seconds to a minute, three new layers will appear in the map and legend: a study area layer, a footprint layer that shows the human influence on the landscape and an intactnesslayer which shows the distribution of intact areas in the landscape.
Then select your area of interest on which you want to evaluated the upstream and downstream area. You have two choices: - Upload a polygon as a geopackage (‘.gpkg’). If you upload a polygon, the projection must be EPSG:3579 (NAD83(CSRS) / Yukon Albers). Moreover, in order to generate upstream and downstream area, the uploaded polygon must completely overlay the study area. The upstream and downstream area won’t be computed beyond the extent of the southeast Yukon.
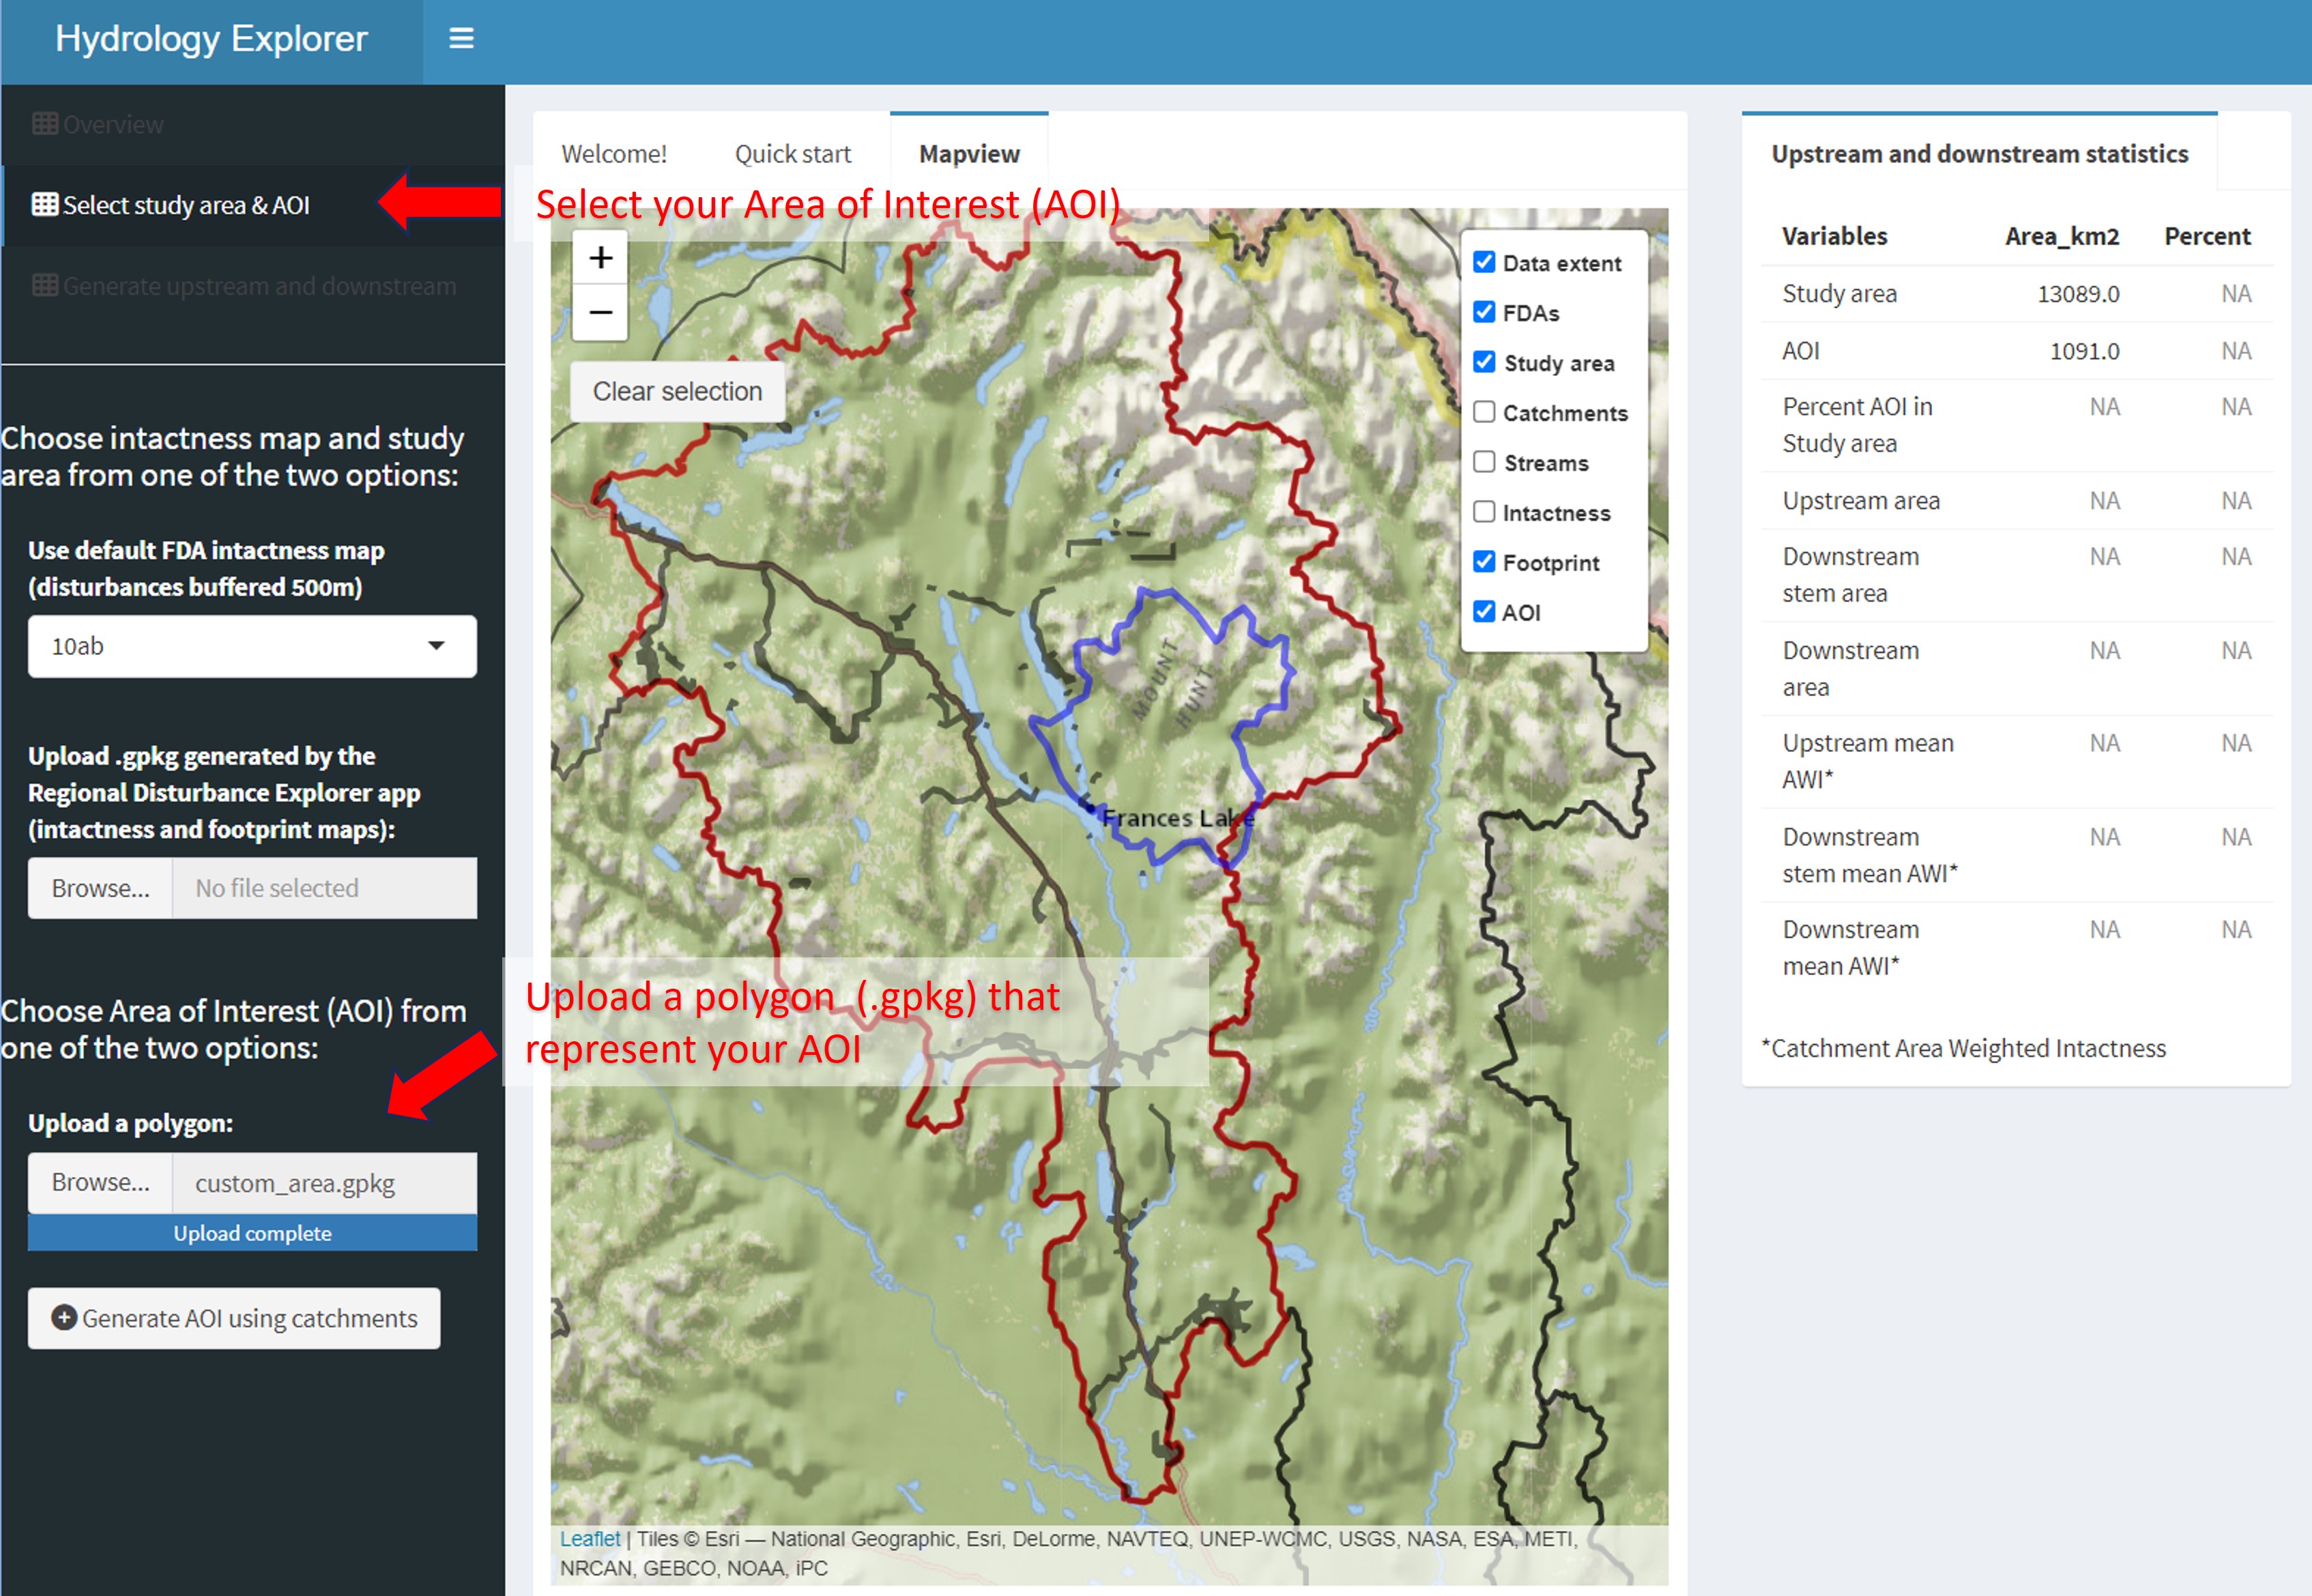
Figure 3. Select the area of interest within your study area by uploading a polygon.
- Select area of interest using the interactive catchments layer. You can either clear your entire selection by using the Clear selection button or by clicking again on the catchment you want to unselect.

Figure 4. Select the area of interest by selecting catchments.
After a few seconds, the map will display and zoom on the AOI layer and the area in squared km will be filled in the upstream and downstream statistics tab on the right sidebar.
Generate upstream and downstream
Click on View upstream and downstream intactness in the left sidebar to display the upstream and downstream area and compute the statistics on intactness.
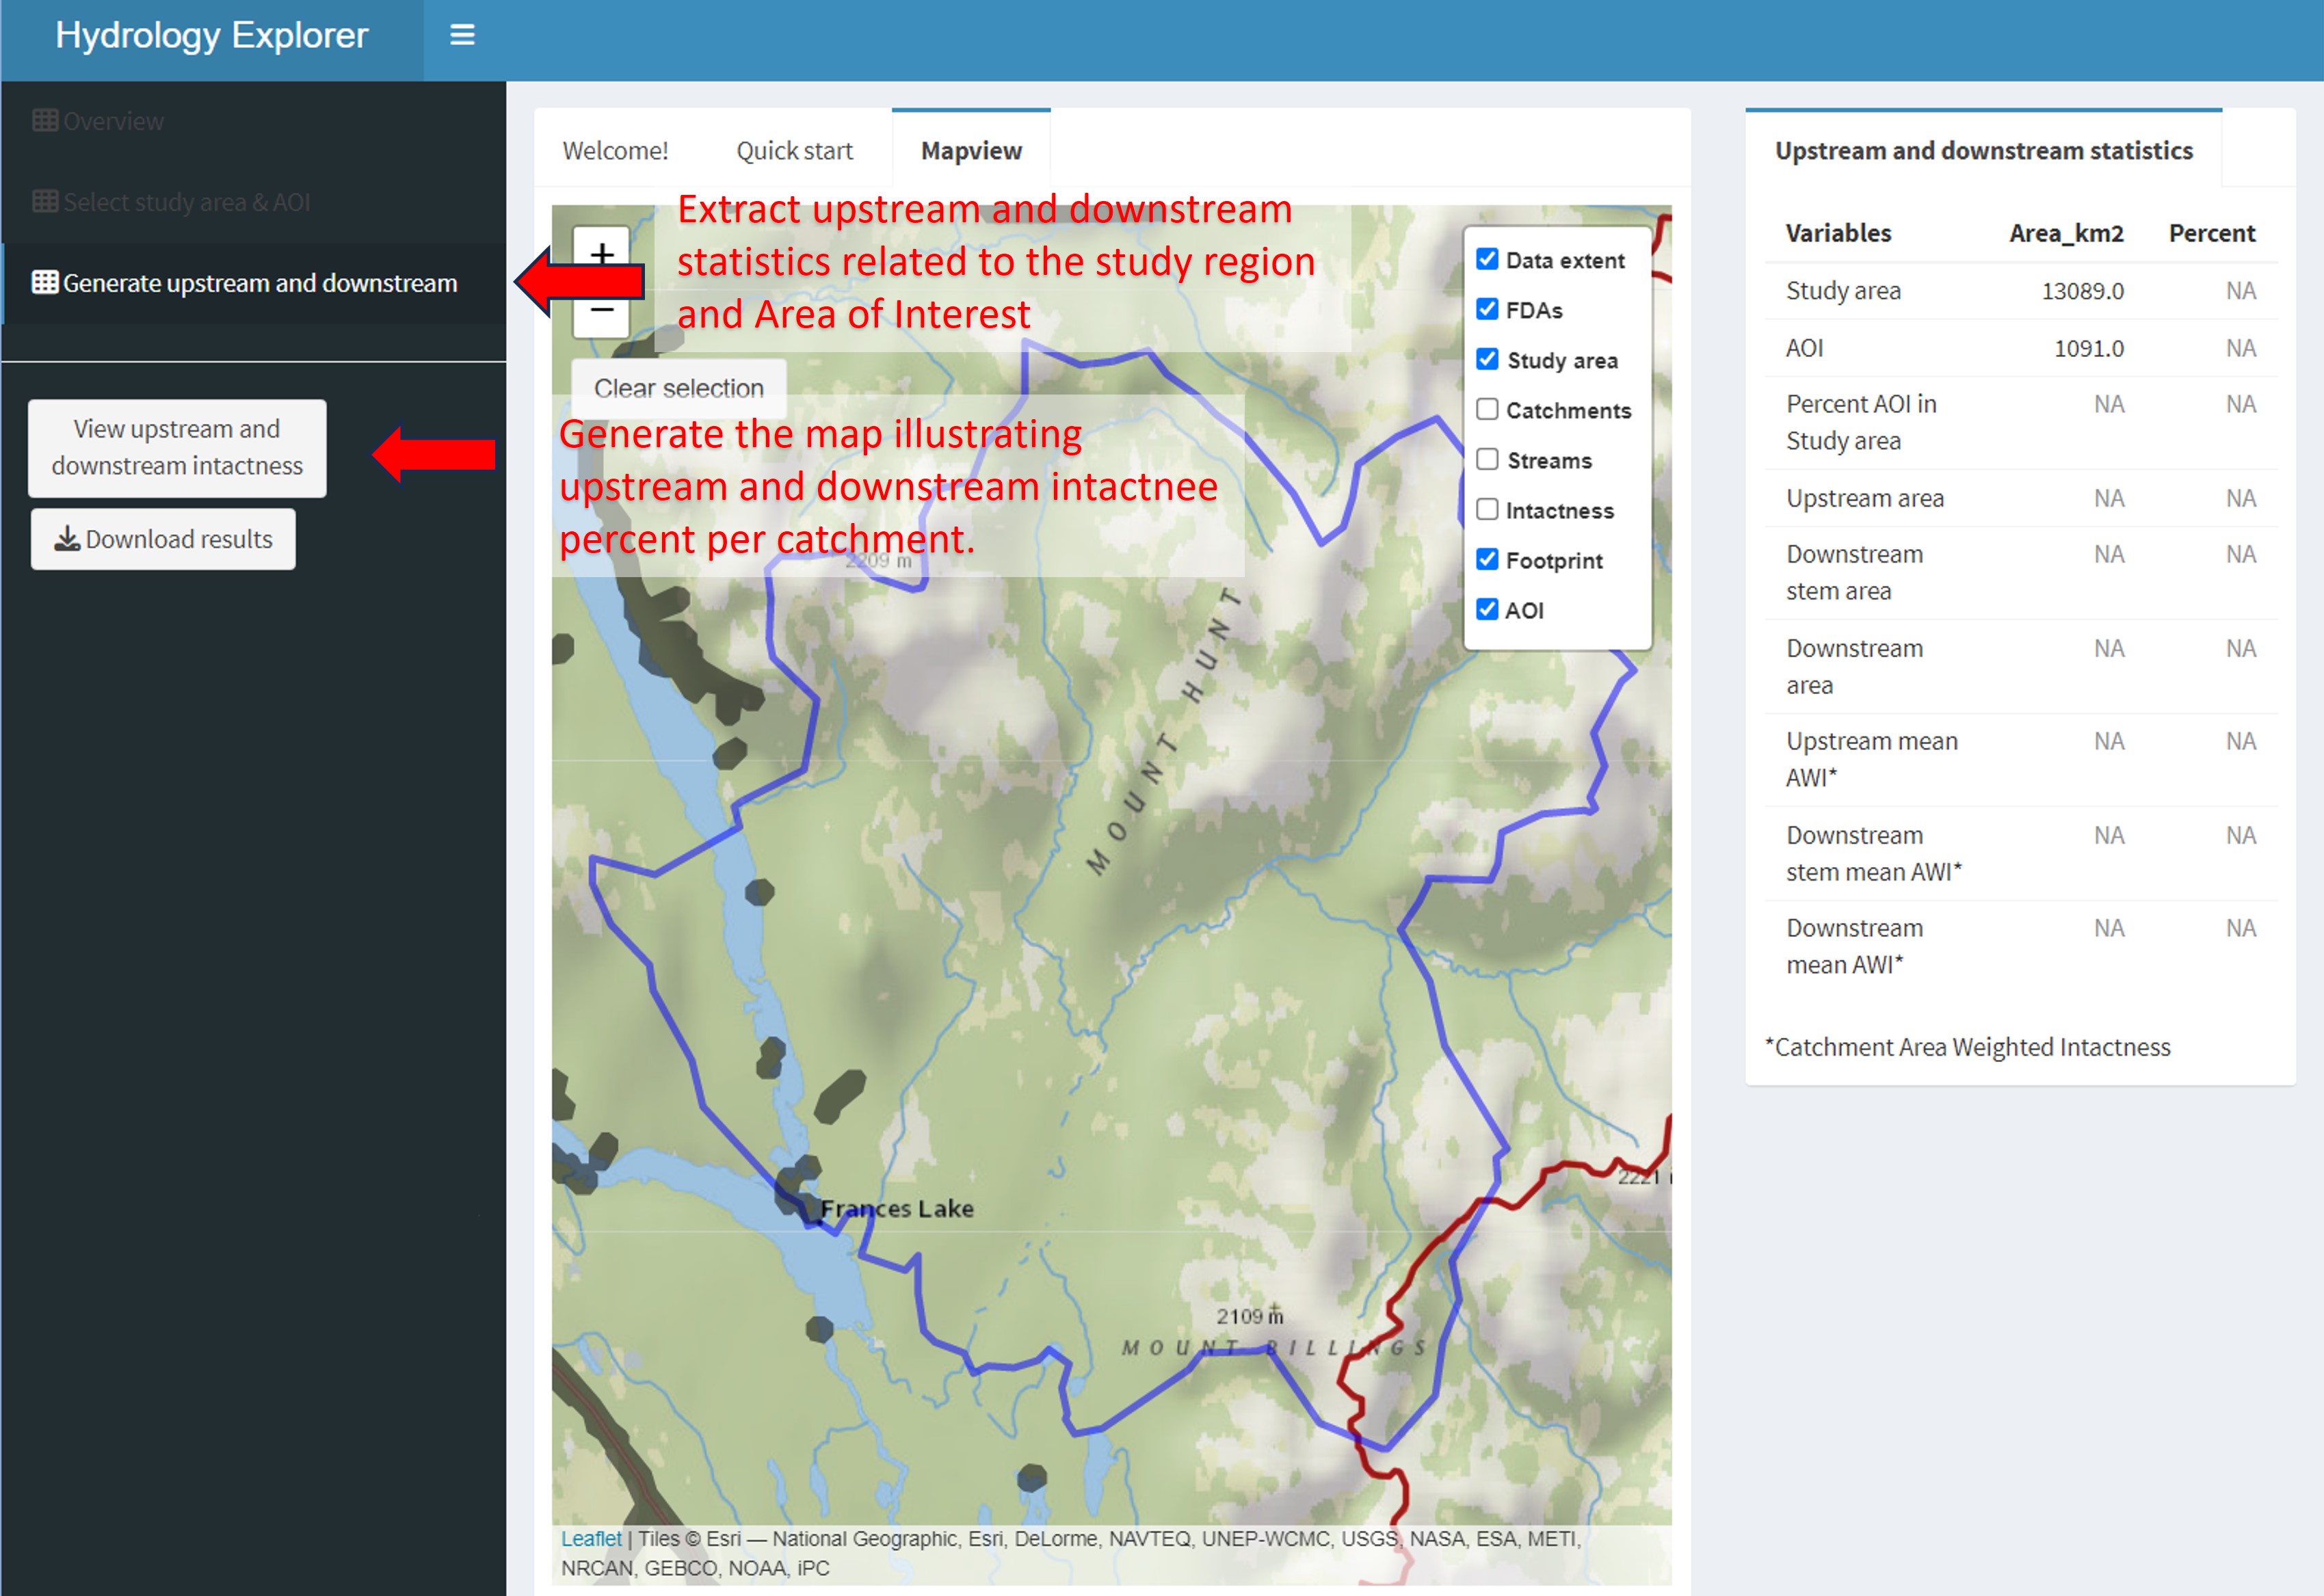
Figure 5. View upstream and downstream area.
Once it is done, the map and legend will add three layers: an upstream area layer that represent upstream catchments of the area of interest, a downstream area layer for catchment that are downstream the area of interest and a downstream stem layer that represent the downstream flow. The upstream and downstream statistics tab on the right sidebar will be updated in order to provide the numbers related to the area of interest selected.
Results can then be downloaded as a geopackage which will include:
- Boundary of the study area
- Footprint map of the study area
- Intactness map of the study area
- Boundary of the area of interest
- Catchments overlaying the study area
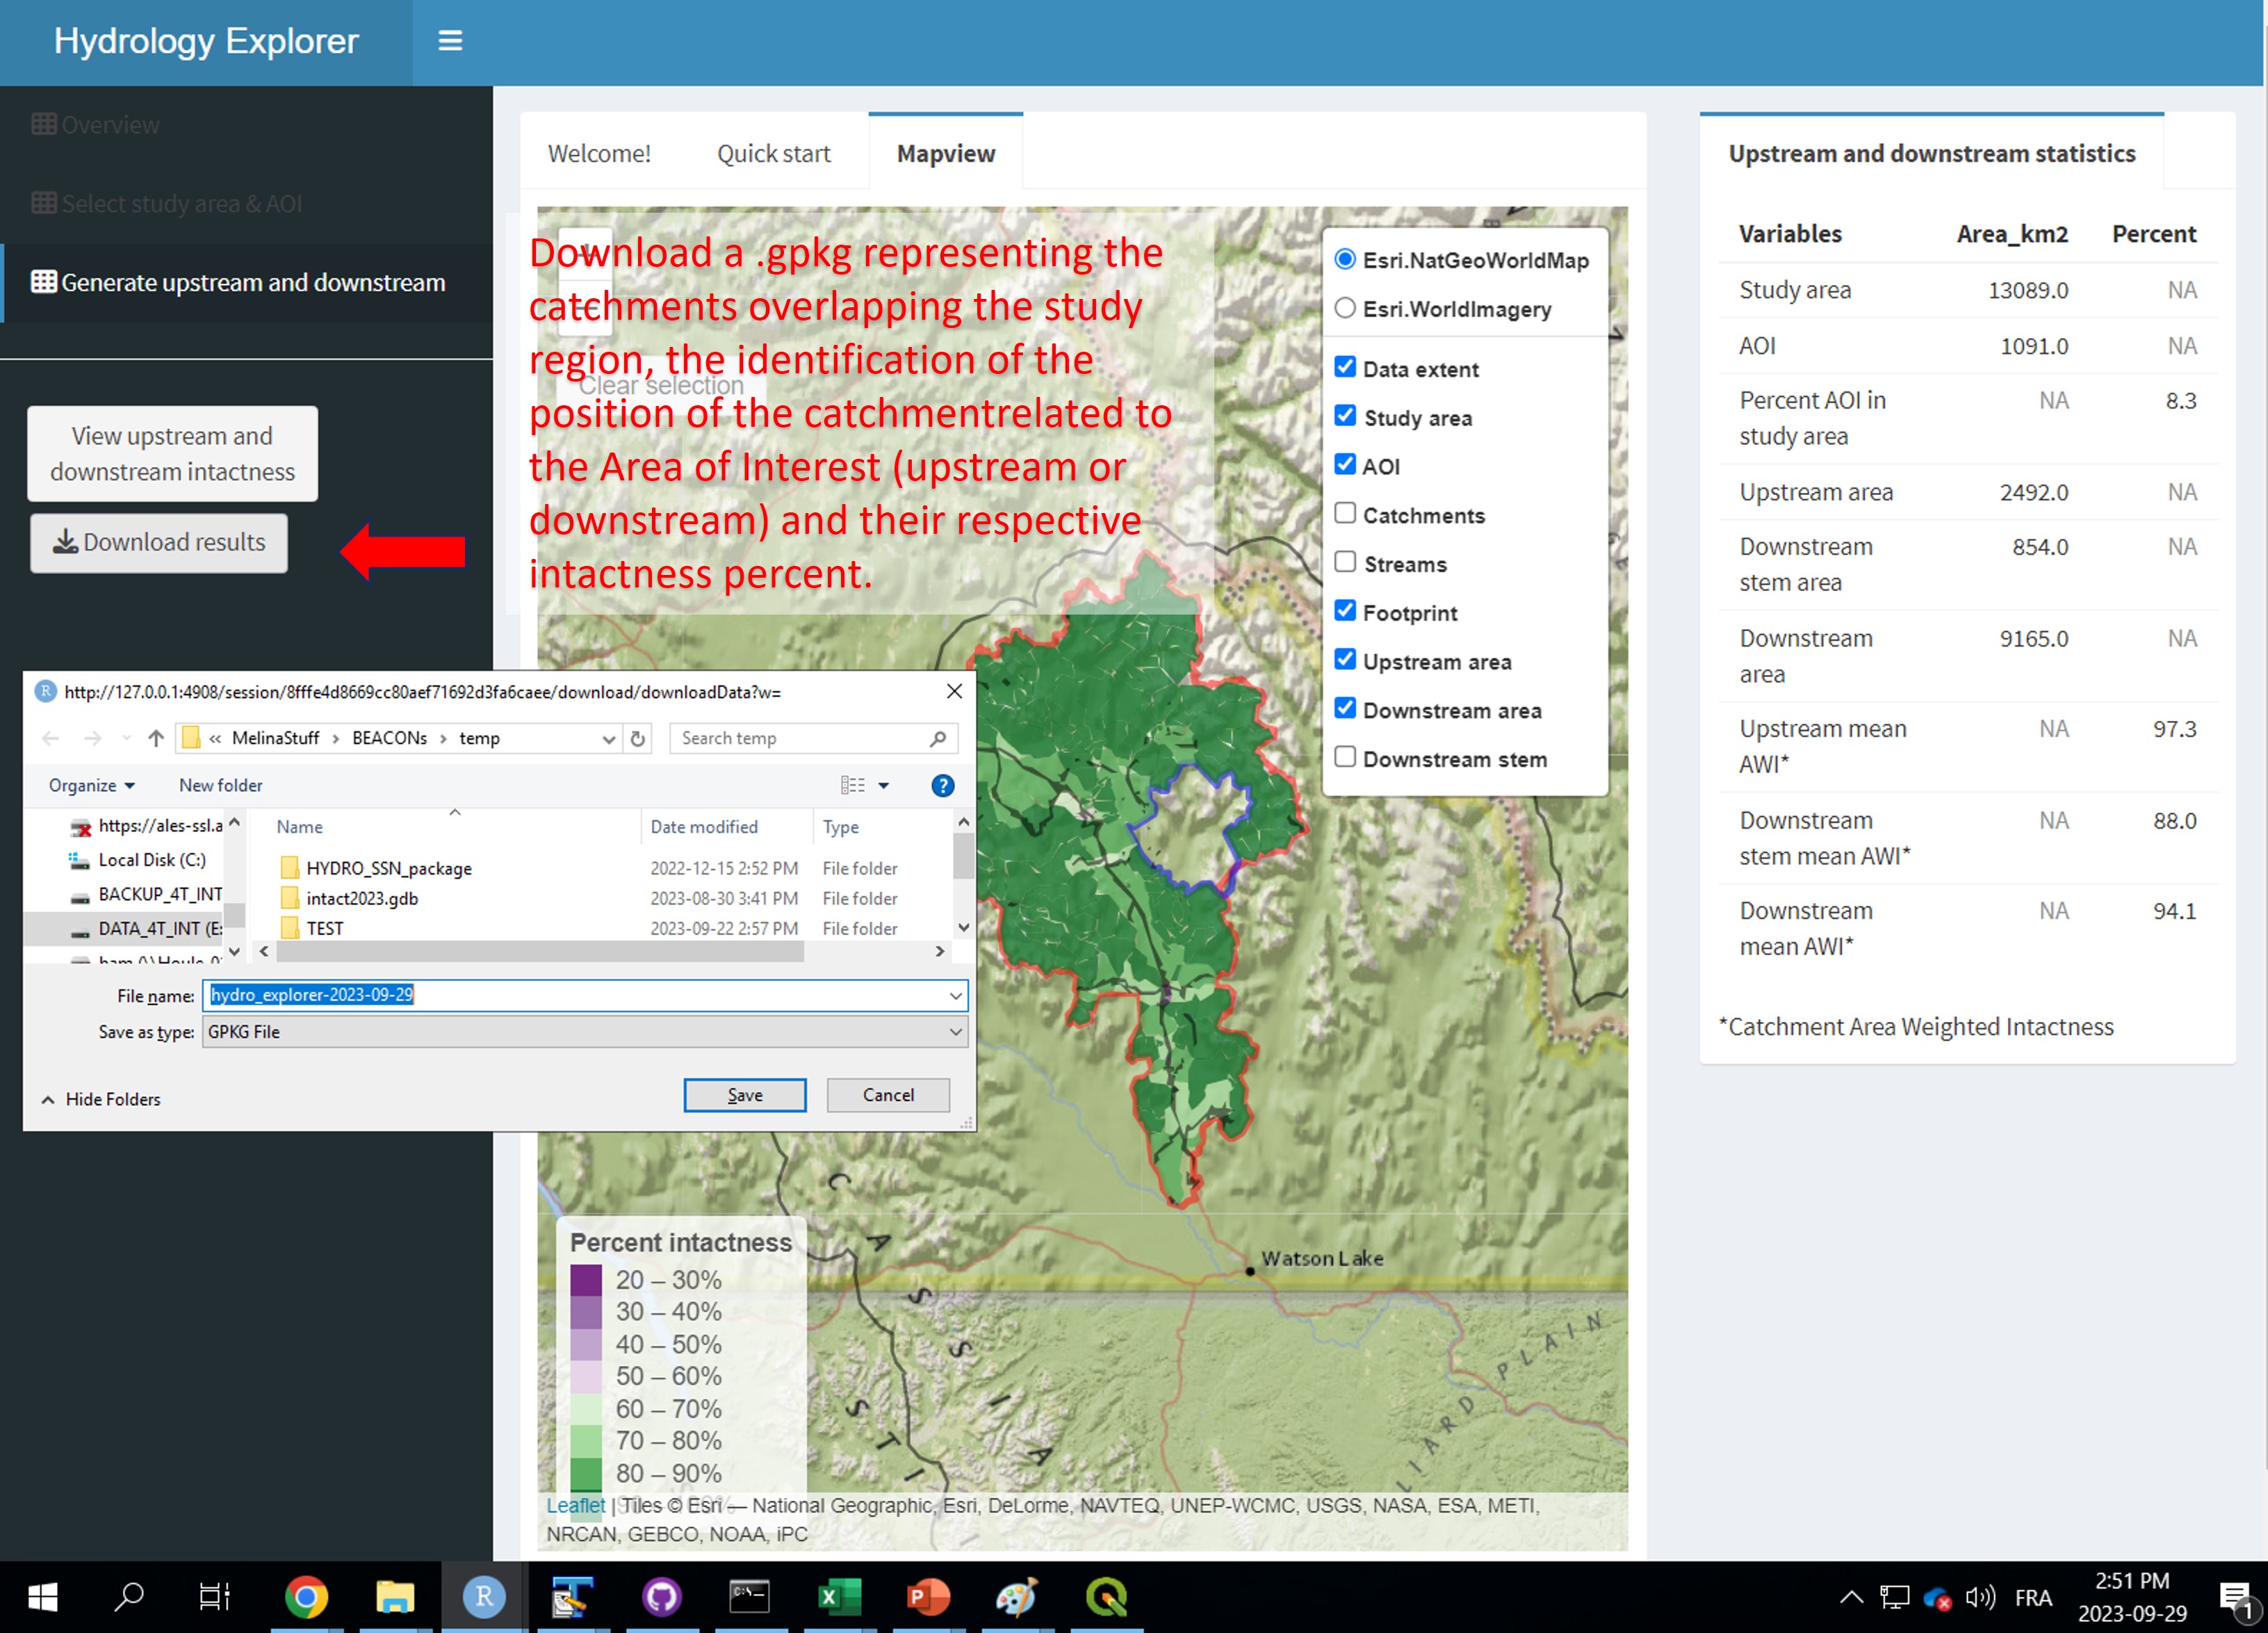
Figure 6. Download the data as geopackage.
The geopackage can be further viewed and analysed in a GIS e.g., QGIS. In the catchments layer, catchment intactness is provided using decimal (0-1) and the identification of each catchment to either upstream, downstream and downstream stem is provided using binomial value.