Disturbance Explorer
Introduction
The Disturbance Explorer is an R/Shiny app that enable users to interactively create a landscape intactness map or, conversely, a human footprint map. The app also allows users to assess the influence of buffer size and minimum patch size on the resulting intactness and footprint maps. To use the app, users need to prepare a geopackage file using several layers. This can be done using the Geopackage Creator app.
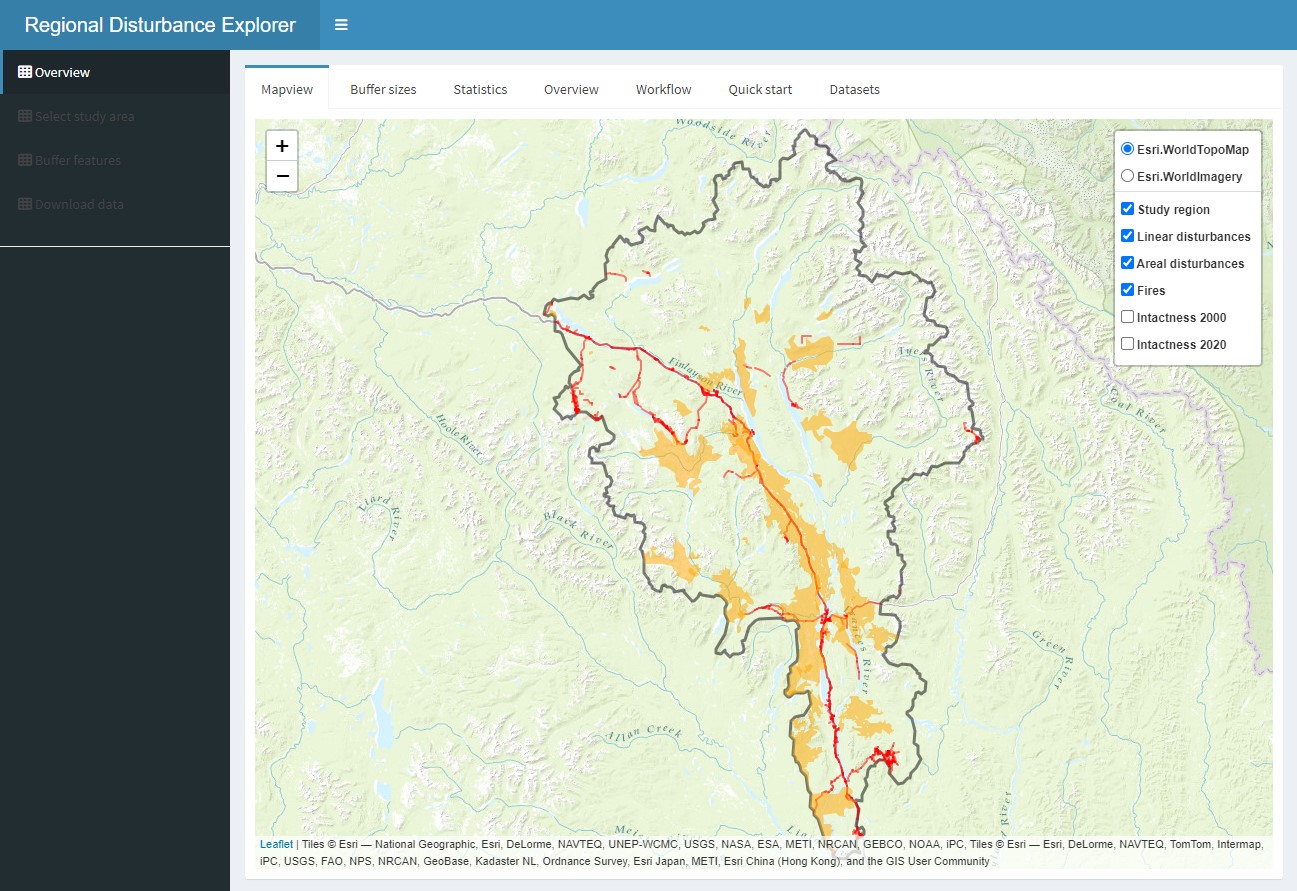
Figure 1. R/Shiny Disturbance Explorer app.
Description
The Disturbance Explorer app consists of four sections:
Overview
- Provides a description of the app, its functionality, and the demo datasets.
Select study area
- Select an existing fundamental drainage area (FDA)
- Upload an area of interest (AOI) polygon as a geopackage (‘.gpkg’)
If you upload an area of interest, the projection must be EPSG:3578 (NAD83 / Yukon Albers). Moreover, in order to generate intactness and footprint maps, the uploaded polygon must overlay the data extent provided within the app.
Buffer features
- view linear and areal anthropogenic surface disturbances, forest fires, and mining claims
- apply a custom buffer around the disturbance features
- set a minimum patch size of intactness areas after the buffering on the disturbance features are applied. This function will remove every patch in the AOI that are considered not sufficiently large to maintain key ecological processes
- compare regional estimates of intactness to those provided by Intact Forest Landscapes for the years 2000 and 2020
Download data
- view a map of intactness that contain only patches that reach the minimum size of intactness areas
- view a map of the buffered footprint
- explore the proportion of intactness and footprint
Input data
The key input data is the regional disturbance dataset. Currently, only open source file geopackages (“gpkg”) can be used. The demo datasets include several fundamental drainage areas (watersheds) located in the Yukon and British Columbia. For a description of the data layers and attributes required by the app, go to the Datasets tab.
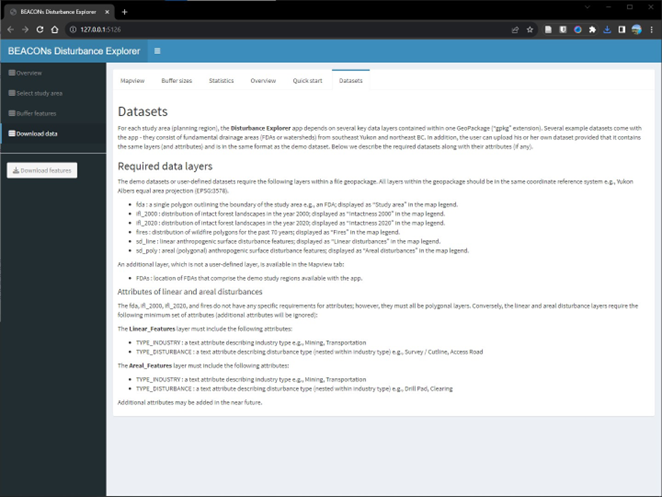
Figure 1. Shiny-based disturbance explorer app.
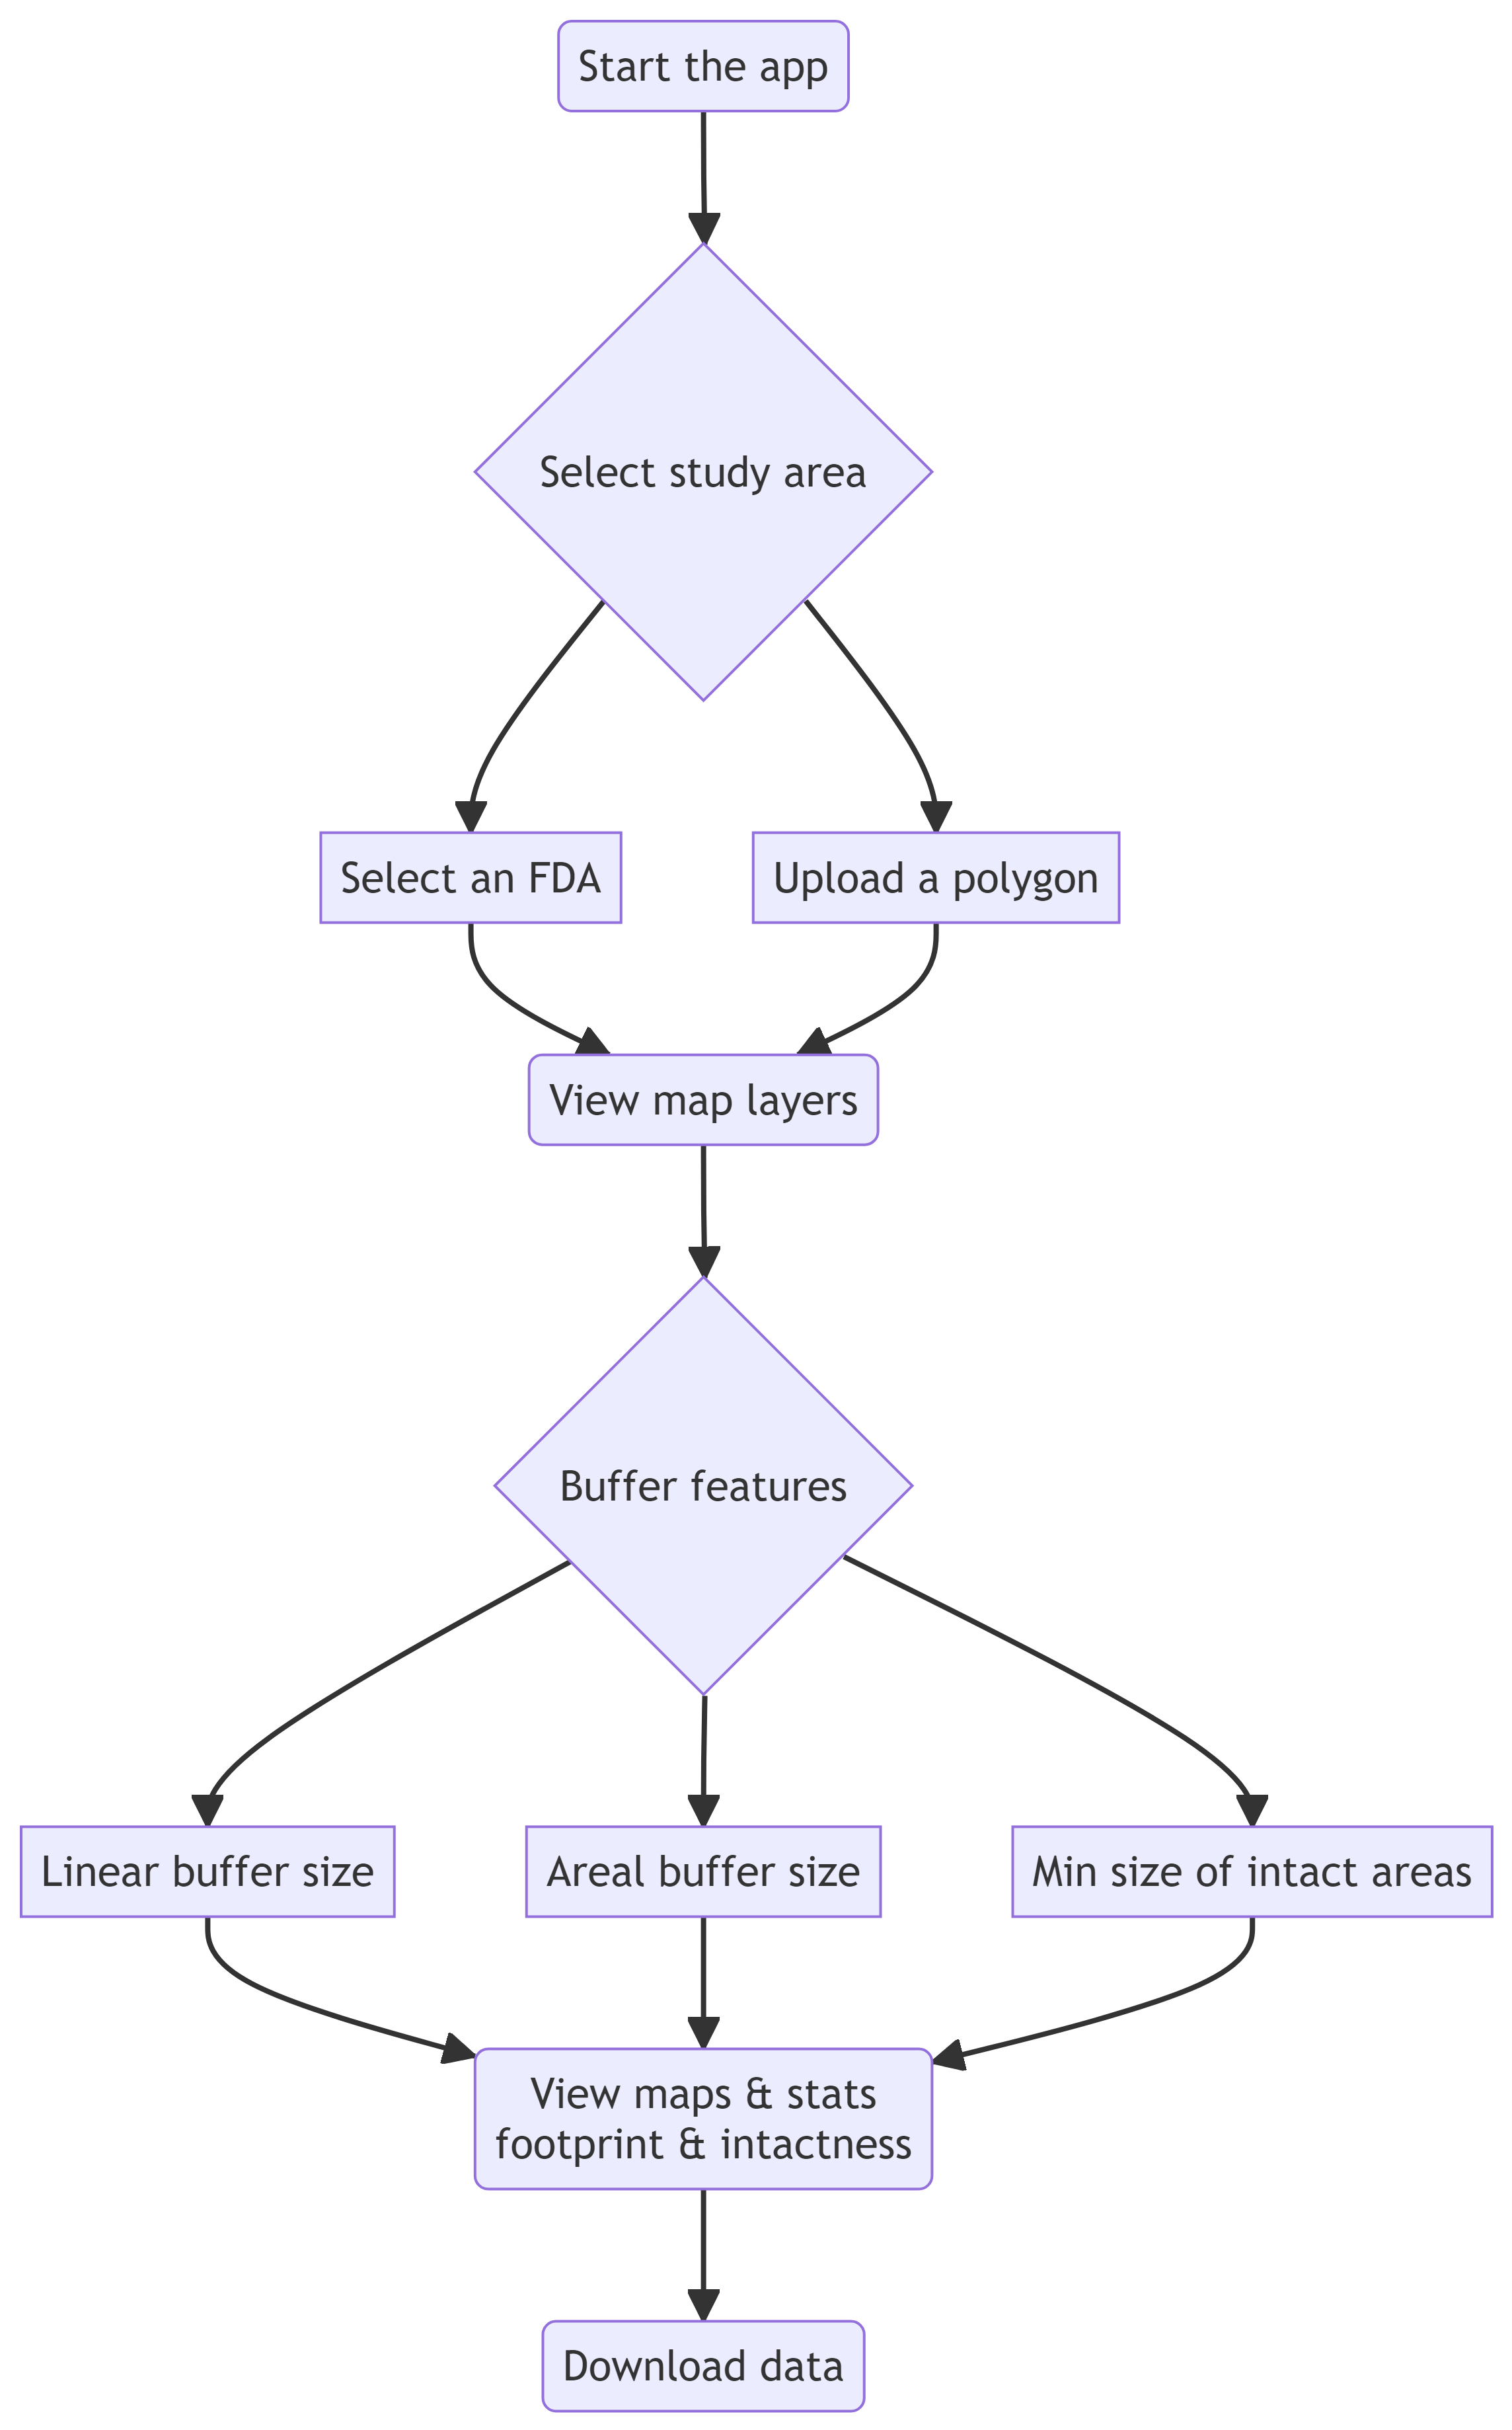
Using the app
The steps for using the app are shown in the flowchart and described in detail below,
Overview
The Overview section provides a description of the app, its functionality, and the demo datasets. You can start using the app by turning on and off the various layers in the map legend.
1. Select study area
Click on “Select study area” to change the area of interest dataset. You have two choices:
- Select an existing fundamental drainage area (FDA). This will include all the layers needed to run the app.
- Upload a user-defined study area as a geopackage (‘.gpkg’). In this case, the onus is on the user to ensure that all the required layers are included, and that the projection is sest to EPSG:3578 (NAD83 / Yukon Albers). See the Datasets tab for more details about required layers.
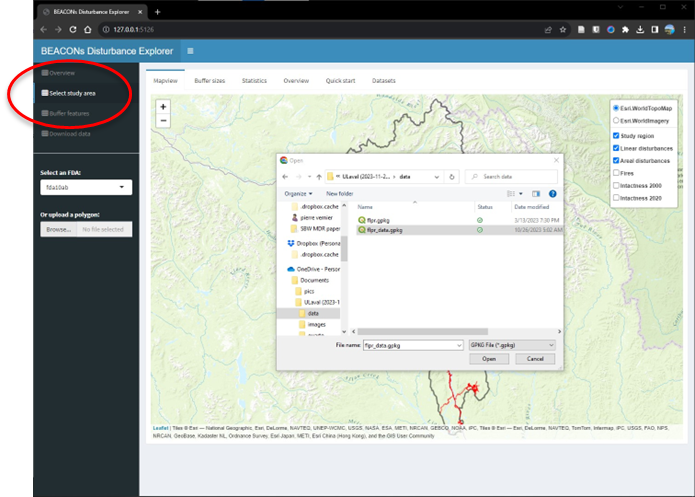
Figure 1. Shiny-based disturbance explorer app.
Once the data layers have been uploaded they will appear in the map legend.
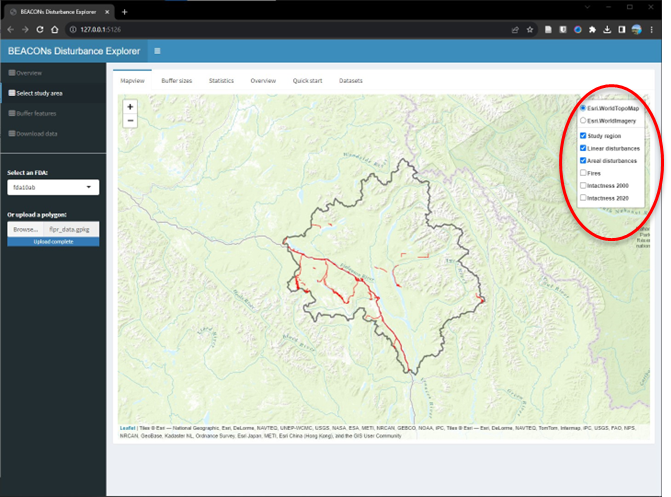
Figure 1. Shiny-based disturbance explorer app.
2. Buffer features
Click on the “Buffer sizes” tab to apply buffers of influence around linear and areal (polygonal) feature types. Simply edit the values in the “BUFFER_SIZE” column.
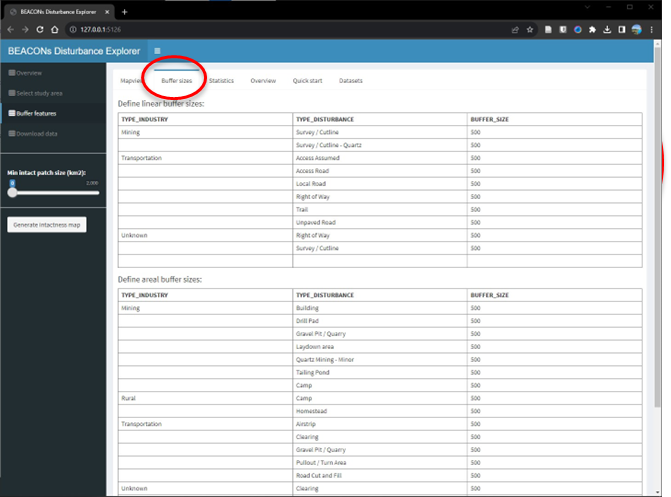
Figure 1. Shiny-based disturbance explorer app.
In the left sidebar, you can also set a minimum patch size of intactness areas after the buffering on the disturbance features are applied. This function will remove every patch in the AOI that are considered not sufficiently large to maintain key ecological processes
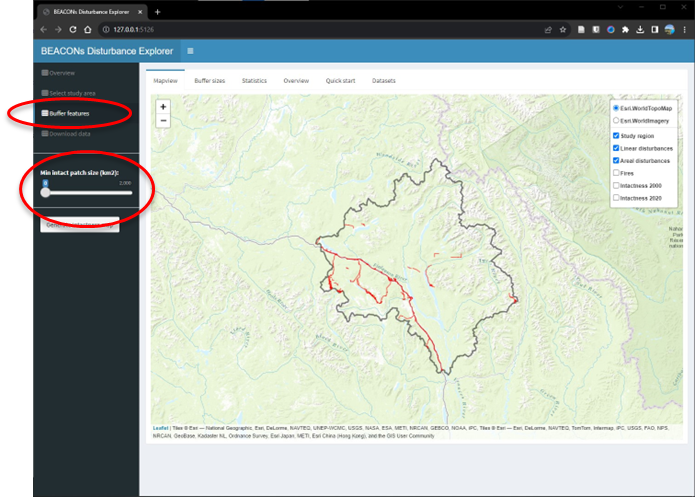
Figure 1. Shiny-based disturbance explorer app.
3a. View maps
After a few seconds to a minute, two new layers will appear in the map and legend: a “footprint” layer that shows the human influence on the landscape and an “intactness” layer which shows the distribution of intact areas in the landscape.
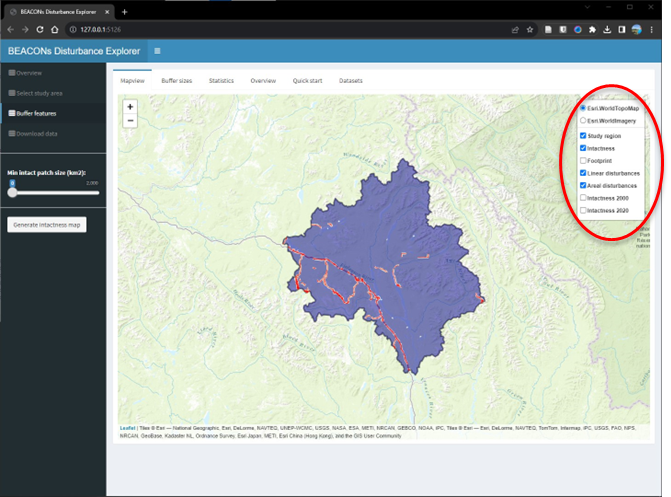
Figure 1. Shiny-based disturbance explorer app.
3b. View statistics
If you click on the “Statistic” tab, you will be able to compare regional estimates of intactness to those provided by Intact Forest Landscapes for the years 2000 and 2020. The areal extent of burned areas are also shown.
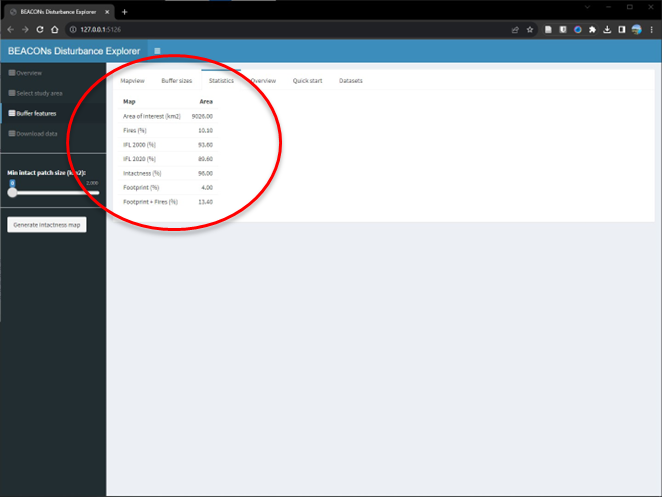
Figure 1. Shiny-based disturbance explorer app.
4. Download data
Finally, you can click on “Download data” in the left sidebar to save the footprint and intactness layers to a GeoPackage format which can be further viewed and analysed in a GIS e.g., QGIS.
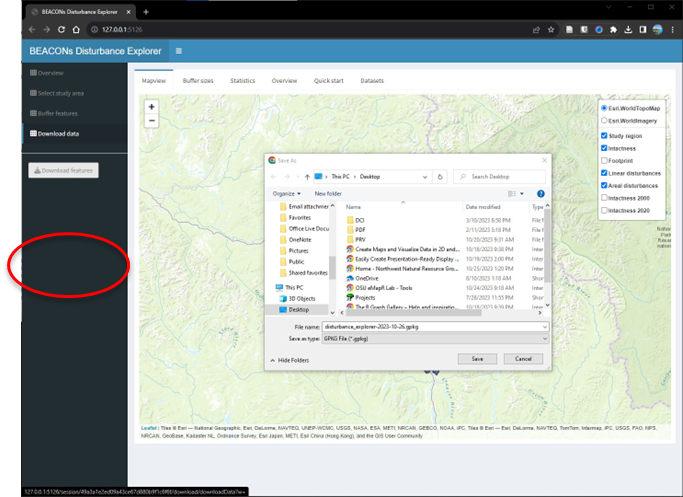
Figure 1. Shiny-based disturbance explorer app.
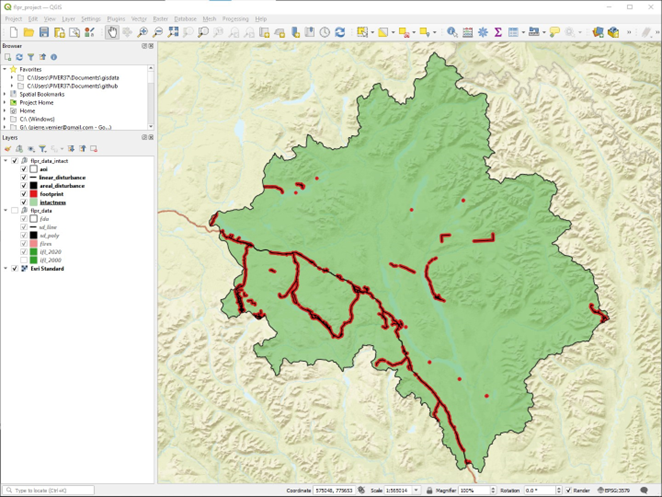
After saving the geopackage file…
Use QGIS or ArcGIS to check to make sure that the intactness and footprint layers exist in your study area.